
Even though an individual campaign may be showing overall profitable results, if you dig into a campaign you most likely will find products that are converting well below your average cost per acquisition and some that are converting well above (the 80/20 rule).
However, and this is assuming you have already segmented your Google Shopping campaigns. Given that you have, how do you optimize individual product bids for Google Shopping ads?
First, your campaigns must have enough historical data to be relevant in your decisions. Google provides several competitive metrics advertisers can use when deciding whether to raise or lower bids for individual products appearing within Google Shopping. These competitive metrics include Benchmark CTR, Benchmark Max CTR, Search Imp Share, Search Lost IS (rank) and Click share.
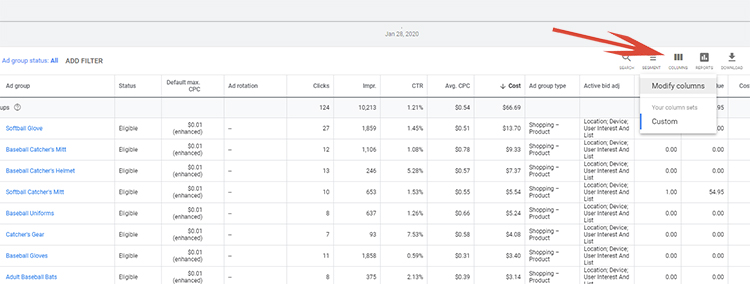
In order to enable various competitive metrics to display while in the Campaigns view, click on the ‘Columns’ button and select ‘Modify columns’.
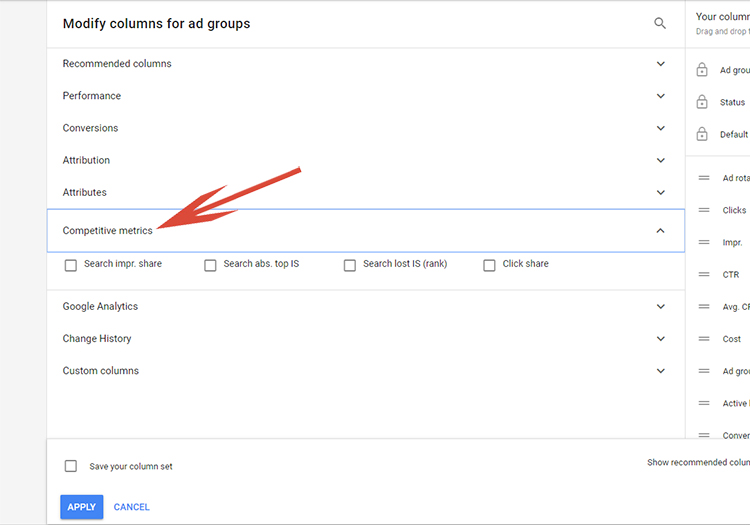
Once the modify columns window opens, an advertiser needs to select ‘Competitive metrics’ under the ‘Select metrics’ columns and add the each competitive metric that they wish to view.
Here are the more important metrics to view when decided whether to raise or lower an individual product bid:
Search Imp Share – The impressions your products have received divided by the estimate number of impressions your products were eligible to receive (available for both the product group and the individual item level).
Search abs. top IS – Short for ‘Search absolute top impression share’ this is the percentage of your Search ad impressions that are shown in the most prominent Search position.
Search Lost IS (rank) – Short for ‘Search lost impressions share’ this is the percentage of impressions your ads did not receive due to poor Ad Rank or insufficient bidding (available for both the product group and the individual item level).
Click Share – The clicks you received on Google’s Search Network divided by the maximum number of clicks that you could have received (available for both the product group and the individual item level).
For optimizing an individual product bid, I prefer to look at the Search Impr. Share in conjunction with Cost, Avg. CPC and Conversions.
Below are some examples of how I use these metrics to determine when to raise, lower or keep current Shopping bids for individual products:
When to Raise a Product Bid
When there is sufficient historical data, Google will add a small graph next to an individual product’s Max. CPC column that when accessed will display how many impressions and clicks and advertiser can expect to receive by adjusting their bid for any product.
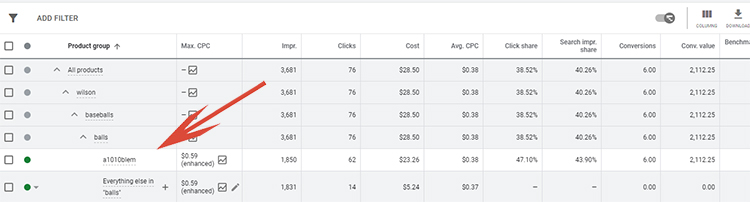
When optimizing products in Google Shopping manually, I tend to look for products with conversions that have a relatively low Avg. CPC where the Search Impr. share is below 50%.
Below, the product ‘a1010blem’ has a bid of $0.59, with 6 conversion in the last 2 weeks and a Search Impr. share of under 50%. In addition, the 6 conversions have generated a total of $2,112.25 in total sales on a spend of $23.26 for a ROAS of a whopping 89.18.
This historical data makes this product an excellent candidate to investigate whether raising the product bid is viable.
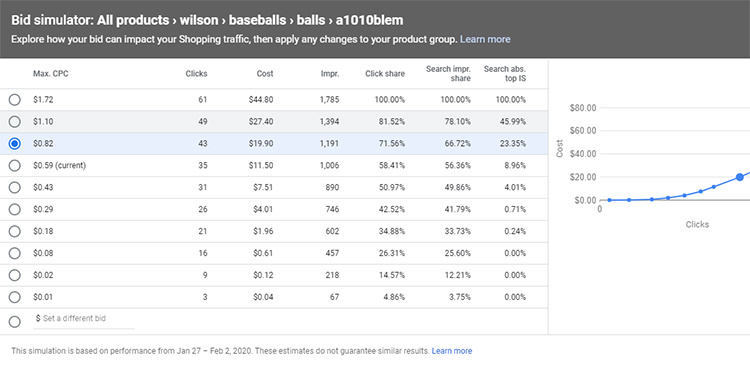
By clicking on the small graph icon, Google opens a Bid Simulator window that shows what clicks, costs and impressions this item can expect if the bid is changed to one of the bid options listed. This is where experience comes into play. I typically will raise the bid to a level that makes sense based on past experience managing similar products within the account.
Here, by raising the bid from $0.59 to $1.10 we will see our search impression share increase to 78.10% and our click share increase to 81.52%.
Quick note, raising bids is a great way to bring more traffic to a product that has historically done well in terms of conversions, but it will also increase your spend and may result in products being displayed for a broader range of search terms. It is highly recommended to continually monitor changes (especially when raising bids) to maintain levels of profitability.
When to Lower a Product Bid
Conversely, sometimes it is necessary to lower a specific product bid that is receiving clicks, but zero or few conversions.
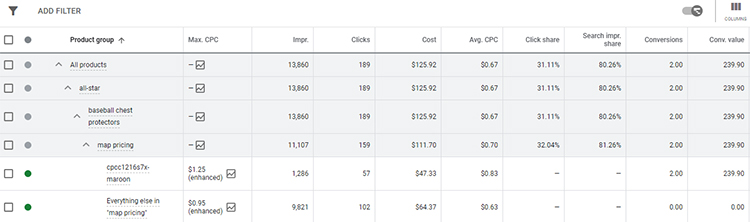
Below, is an item ‘ckcc1216s7x-black’, where the bid is at $1.25, the search impression share is 89.38% and the average CPC is $0.60. This product has received 131 clicks and incurred a cost of $79.21 over the last two weeks.

After checking to ensure there are no issues on the website or in the Merchant Center account thus ensuring that there is no issue with the product, I decide to lower the bid.
By again clicking on the small graph icon located next to the Max. CPC field, I can view Google recommendations of how many clicks, impressions and costs I can expect the item to incur by lowering the bid.
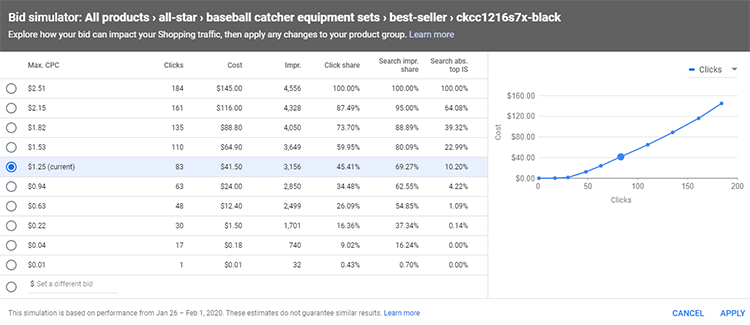
In this instance, I am going to lower the bid from $1.25 to $0.94. This will still allow this product to still receive some clicks and impressions; however, the product will be shown less often allowing other products in this subsegment to appear more often for the same keyword searches. I will continue to monitor and review the bid once additional historical data is available based on the newly adjusted bid.
When to Not Adjust a Product Bid
For advertisers, just as important as raising and lowering individual bids is determining when to NOT adjust a bid for a particular product.
Below, the product ‘cpcc1216s7x-maroon’ has a bid of $1.25, with 2 conversion in the last 2 week; $47.33 in spend and revenue generated of $239.90. This calculates to a ROAS of 5.07.
With all the criteria I use to raise a bid, I would like to view how many additional impressions, clicks and costs Google expects this product to receive if I raise the bid. Therefore, again I click on the graph icon next to the Max. CPC field.
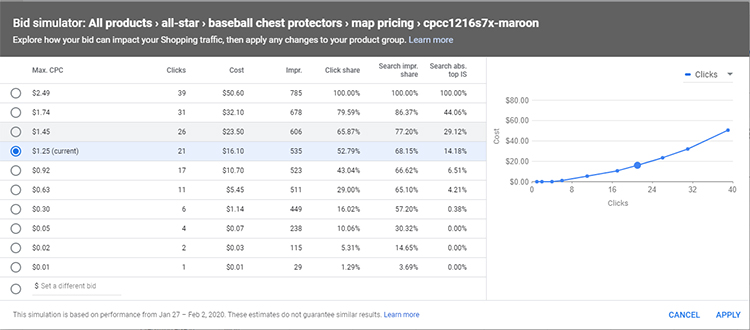
For this item, even if I increase the bid approximately 50% from the current $1.25 to $1.74 it would only add about 150 more impressions, but would double spend from $16.10 to $32.10 (almost 100%).
Also, keep in mind that this is raising the Max CPC. When looking at historical data, I can realize that this product has been actually incurring an average CPC of $0.83 per click. With this information available, I decide that raising the bid is not a good value and that it does NOT make sense to raise the bid and will leave the bid at $1.25.
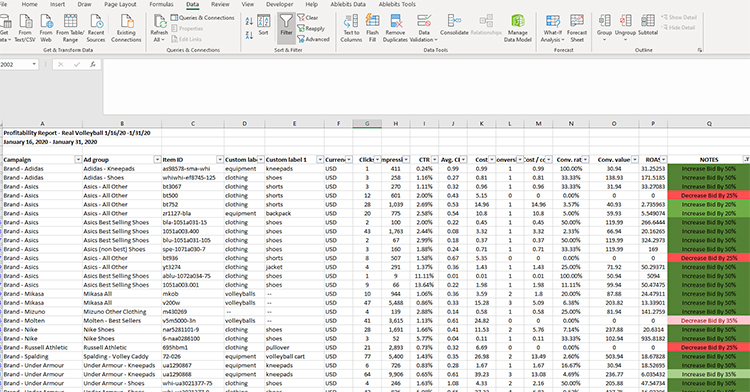
Profitability Report
The process of manually adjusting bids works great if you need to optimize a handful of products, but what if you have hundreds or even thousands of products that you want to optimize for profitability?
For accounts with large offerings, I use a self-created process that I have aptly named my ‘Profitability Report’.
Automated rules are not available for Google Shopping items. Therefore, the purpose of the profitability report is to naturally raise product bids for items that convert, while lowering bids for items that are not converting using a systematic form.
Creating The Profitability Report
- Click on reports icon in top tool bar.
- Select Predefined Reports > Shopping > Shopping – Item ID.
- This should populate the following key performance indicators (KPIs): Item ID, Clicks, Impressions, CTR, Avg CPC, Costs, Cost/Conv and Conv. Rate.
- You will then want to add Conversion Value, Campaign and Ad Group. Note, adding a column is done by dragging the desired field from the left menu to the table. It may be necessary to click on the 3 horizontal lines to display all options.
- Save As ‘Profitability Report’
- Note, once the report is saved you can schedule the created report to automatically run so next time the report will be available in advance.
Using The Profitability Report
- Click on reports icon in top tool bar.
- Download the profitability report for the desired date range (suggestion is weekly or bi-weekly).
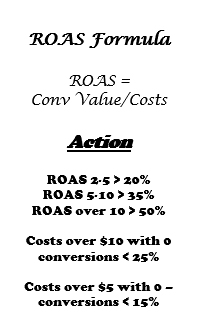
- Create a new column for rate on ad spend (ROAS) – conversion value/costs.
- This is where some discretion comes as far as optimizing and campaign goals including the overall profitability you are trying to achieve. For the accounts that I privately manage, if the ROAS is between 2 -5, I raise by 20%; if between 5-10 I raise 35%; if over 10 I raise 50%. Most of my accounts, I use a $5 threshold for costs; however, this can be adjusted depending on the accounts volume.
- To make it easier, I add a comment field with the action to on the item and highlight with a color – example green for all items that need to be raised.
- Next I sort by poor performing item ids. To do this sort by cost from largest to smallest.
- Set your criteria. For example, in the accounts I manage I lower bids by 25% on any item that spends over $10 with $0 sales and lower bids by 10% on any item that spends over $5 with $0 sales. Again, I color code the items that need to be decreased in order to easily determine.
- I then sort the excel sheet by Notes and then Ad Group.
- You now have an easy to read file where you can make actionable changes.
Final Word
Optimizing bids for individual products can be a labor-intensive process. However, it also can be a rewarding process in gaining the highest return on advertising (ROAS) available for your dollars. In addition, there are other factors to consider before raising or lowering a product bid such as: is the product in stock, is the product a seasonal seller and are there other factors that can account for increase/decrease sales such as a competitor discounting.
However, by taking advantage of Google’s competitive metrics, advertisers can optimize their Shopping Campaigns at the product level. Quick warning, for this strategy to be the most effective, advertisers should ensure they have previously segmented their Shopping Campaigns. For a review on segmenting, refer to my article – How Segmenting Google Shopping Campaigns Can Boost Profitability.
Looking for More Information on Google Advertising?
Check out the all new The Academy of Internet Marketing (www.theacademyofinternetmarketing.com), the premier online marketing destination for small to mid-sized e-commerce businesses serious about substantially growing their online sales plus exclusive access to me, author of Make Each Click Count, The TOP Guide To Success Using Google AdWords.

If you have the dedication and are ready to take your online sales to the next level, then The Academy of Internet Marketing was created for you. It provides the tools in the form of knowledge of what works today. Join us and see what makes us special and together we will grow your business.
If you are ready to take your online advertising to the next level, I welcome you to take a trial. It only costs $1 for access.
Happy Marketing!
Andy Splichal
ABOUT THE AUTHOR

Andy Splichal is the founder of True Online Presence, the founder of The Academy of Internet Marketing, author and certified online marketing strategist with twenty plus years of experience helping companies increase their online presence and profitable revenues. To find more information on Andy Splichal, visit trueonlinepresence.com or read The Full Story on his blog, blog.trueonlinepresence.com.