There are many times that things need to be equal. When you are splitting a sandwich in half for your kids that should be equal or when you are balancing your finances all that should be equal.
However, how much you are bidding for your ads to appear on various devices between desktop, mobile and tablets using paid advertising that should almost NEVER be equal.
It is no secret that mobile has exploded and has come a long way in a short period of time. I distinctly remember attending the Internet Retailer Conference in 2011. The theme of the conference that year was to NOT concentrate your efforts on mobile, but instead concentrate your marketing efforts on social media especially Facebook and Twitter.
Wow were they wrong!
Although social marketing is catching up in terms of importance and should not be ignored, there was no doubt with me then or now that mobile is a much more important aspect of today’s online marketing.
A huge percentage of Google searches has shifted from desktop to mobile and the percentage of users using mobile devices continues to climb. In fact, Google now reports that over 50% of searches are now performed using mobile devices.
Statistics are helpful, but the real question becomes what is the appropriate bidding strategy for mobile devices for your company?
The answer depends on your specific company and can be determined in part based on your answers to the following questions:
- What percentage of your traffic comes from mobile?
- What is your conversion rate on mobile visitors?
- Is your site optimized for mobile (how does it look for mobile users)?
- How are your current campaigns working for mobile including your current ROI and ROAS (how profitable are they)?
These are fundamental questions that each marketer needs to know the answer in order to begin optimizing their paid advertising for mobile.
Fortunately, by having Google Analytics installed along with the historical data available from the Google Ads account the answers to these questions can be easily attained.
Answering The Questions
The first two questions of what percentage of your traffic is generated from mobile devices along with the conversion rates generated from mobile visitors can be answered at the same time.

In order to view an overview of your traffic, your will want to use Google Analytics. Later, when adjusting bids for individual campaigns you will review historical data and adjust the bidding within the Google Ads interface.
The first step is to open your Google Analytics account. Hopefully, you already have Google Analytics properly installed as it provides much useful data for measuring the health of your overall website other than the conversions segmented by device.
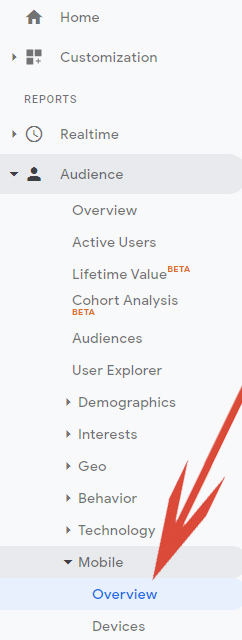
In the left menu, select ‘Audience’ then ‘Mobile’ then ‘Overview’. Here you will be able to view your conversion rates based on device – mobile, desktop or tablet.
The numbers typically will appear as the example below:

This is a very typical results for ecommerce retailers. It reveals that almost twice the traffic is coming from mobile devices (4,605 visits in mobile vs. 2,883 visits in desktop).
Looking at this report also reveals that the mobile conversion rate is only about 1/3 of that generated by desktop devices (0.64% – mobile vs 1.81% – desktop).
The report also shows statistics for tablets. Also, very typically for this retailer tablets have about 1/2 the traffic of desktop and the conversion rates are somewhere between mobile conversion rates and desktop conversion rates at 0.90%.
Now that we have answered the first two questions of what percentage of traffic is coming from mobile and what the conversion rates are for mobile devices, we can look at the question – is your site optimized for mobile?
There are many different ways to optimize your website for mobile. In fact, Google offers free tools such as testing the speed of your website available through Google’s developer tools – https://developers.google.com/speed/pagespeed/insights/ (which is very important).
However, I find that the most effective way to see if your website is optimized for mobile is to place test orders for your products using mobile devices. Put yourself through the user experience repeatedly and you will discover if there are issues that could be lowering your conversion rates.
Ask your employees or family or friends to also test and give you honest feedback of anything they see that may prevent them from ordering using their iPhone or Android. Today, almost everyone has experience online shopping and you will find this type of feedback provides valuable and actionable insight.
In fact, I recommend personally placing orders using different devices at least on a bi-weekly basis in order to deeply understand your website’s checkout experience.
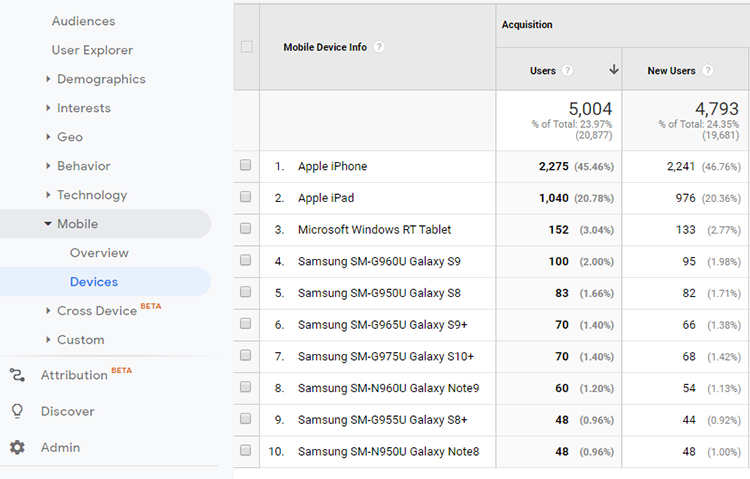
Although, most mobile traffic comes from Apple iPhone’s make sure you do not ignore other devices. In order to view which devices are generating traffic again return to Google Analytics.
You are going to go to the left menu again and select ‘Audience’ then ‘Mobile’ however this time select ‘Devices’. This report will display the traffic and conversion rates based on the different type of device – Apple iPhone, Tablet type, Samsung Android type, etc.

Making Actionable Changes
By viewing historical data within Google Analytics, we are able to discover what our overall traffic and conversion rates are based on device. However, to make actionable changes on our bidding, we need to use the Google Ads interface to review our historical data.
Bid adjustment for devices is available at the account, campaign or ad group level within Google Ads account. If you have a large selection of products, you will discover that conversion rates based on device can vary greatly depending on your product offering. This is another reason that it is critical to subdivide your campaign. For information how to best segment your campaigns – review my article – How Segmenting Google Shopping Campaigns Can Boost Profitability.
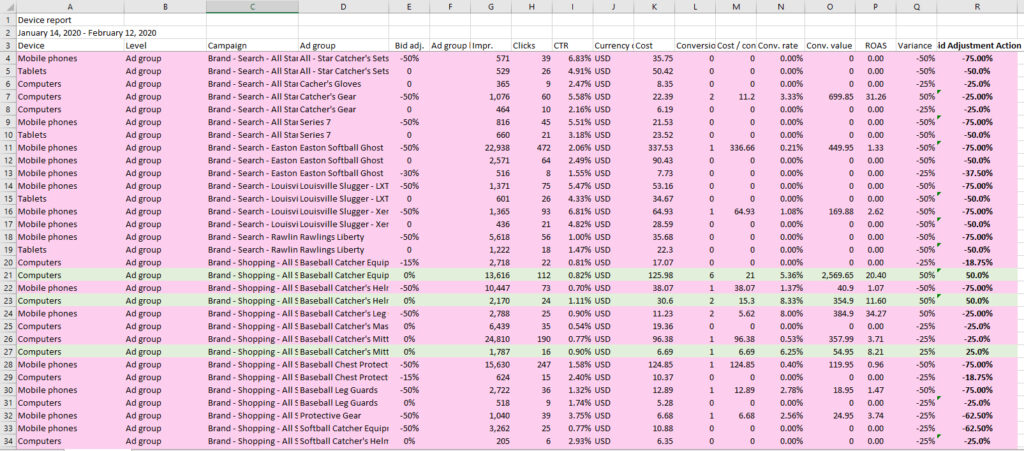
Creating A Device Adjustment Report

- From the All Campaigns view, click on ‘Devices’ in the left navigation menu.
- Adjust columns to display the following KPIs: Device, Level, Added to; Bid adj, Ad Group Bid Adj, Impr., Clicks, CTR, Costs, Conversions, Cost/Conv., Conv. Rate and Conv Value.
- Adjust the date to the desired date range (recommended last 30 days).
- Use the filter button to show only data that has spent more than $5.
- Download the report and save.
Using The Device Adjustment Report

- Open the Device Adjustment Report.
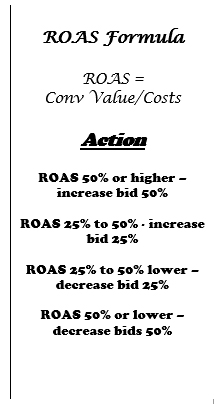
- Create a new column for rate on ad spend (ROAS) – conversion value/costs. With the ROAS include for the total (last row of file).
- Use the total column’s ROAS to create a variance of 50% higher; 25% higher; 25% lower and 50% lower.
- Example, assume your average ROAS is 8.9
- Multiply 8.9 by 1.5 = 13.35 (50% higher)
- Multiple 8.9 by 1.25 = 11.13 (25% higher)
- Multiple 8.9 by 0.75 = 6.67 (25% lower)
- Multiple 8.9 by 0.50 = 4.45 (50% lower)
- Sort the file by ROAS from high to low.
- Sort by Bid Adj. column and where there is no current bid adjustments, replace the ‘- -‘ with a zero (0).
- Add a new column named variance. If it is in the 50% range, marked those rows 50%; if in the 25% range mark 25%; if in the 25% lower range mark -25%; if in the lower 50% range mark -50%. Do not add to field where ROAS is between 25% higher or 25% lower than average.
- For items with no conversions, if there is a spend over $20 – mark variance column with -50%. If spend between $5 – $20 mark variance column -25%.
- Sort by variance and delete rows where the variance is blank. These Ad Groups already have an optimal bid producing between a ROAS of between 25% below to 25% above the account average.
- Create a new bid adjustment column. This is where it gets a bit complicated, but entering the correct formulas is essential and will pay dividends when optimizing your account:
For items where the variance is positive and current bid adj is negative – use the following formula.
(1 * variance) + current bid adjust.
Excel formula = (1*Q127)+E127
For items where the variance is positive and current bid adj is positive – use the following formula.
(current bid adj * variance) + current bid adj
Excel formula = (E331*Q331)+E331
For items where the variance is negative or positive and current bid adj is negative – use the following formula.
(current bid adj * negative variance) + current bid adj
Excel formula = (E122*-Q122)+E122
For items where the variance is negative and current bid adj is positive – use the following formula.
current bid adj + (current bid adj * variance)
Excel formula = E272+(E272*Q272)
For items where there is no current bid adj and variance is positive or negative – use the following formula.
(1*variance)+ current bid adj
Excel formula =(1*Q324)+E324
10. Once you have all of the bid adjustments in place, highlight all negative bid adjustments in red and all positive bid adjustments in green.
11. Sort by campaign, then ad groups. Now you have an actionable file based on historical results!

Final Word
Remember, when you were daydreaming in math class and wondering when you would ever use advanced match formulas in real life?
Here it is!
We have seen how bidding the same for all devices is a fool’s game as all devices do not convert equally.
We also see how creating an actionable file takes work to create. However, I can guarantee that your competitors most likely are not spending the time to effectively and systematically adjust their bids based on device.
By doing the work, you are going to have a huge advantage over your competition and be able to precisely optimize your bids based on what device they are using when coming through paid ads. This process will effectively increase bids where conversions have historically occurred and decrease bids where they have not.
Also, remember to use these advanced techniques, you must first segment your campaigns. For a review on segmenting, review my article – How Segmenting Google Shopping Campaigns Can Boost Profitability.
P.S. – We are currently in development creating an automated tool to calculate bid adjustments for individuals.
Looking for More Information on Google Advertising?
Check out the all new The Academy of Internet Marketing (www.theacademyofinternetmarketing.com), the premier online marketing destination for small to mid-sized e-commerce businesses serious about substantially growing their online sales plus exclusive access to me, author of Make Each Click Count, The TOP Guide To Success Using Google AdWords.
If you have the dedication and are ready to take your online sales to the next level, then The Academy of Internet Marketing was created for you. It provides the tools in the form of knowledge of what works today. Join us and see what makes us special and together we will grow your business.
If you are ready to take your online advertising to the next level, I welcome you to take a trial. It only costs $1 for access.
Happy Marketing!
Andy Splichal
ABOUT THE AUTHOR

Andy Splichal is the founder of True Online Presence, the founder of The Academy of Internet Marketing, author and certified online marketing strategist with twenty plus years of experience helping companies increase their online presence and profitable revenues. To find more information on Andy Splichal, visit www.trueonlinepresence.com or read The Full Story on his blog, blog.trueonlinepresence.com.


