
As an eCommerce marketer you occasionally may find it a challenge keeping your focus where there is the highest opportunity for potential growth.
With all the various ways that customers can find your products – email, pay-per-click, organic and direct it can be difficult to know which marketing channel to focus your efforts.
More and more, it has become essentials for retailers to focus on driving potential customers to their website using paid traffic.
Options for paid traffic include Google Ads (shopping and search), Bing/Microsoft Ads, Pinterest, Facebook Ads, eBay, Walmart and Amazon just to name a few. And these are only just some of the available marketing channels!
Today, most retailers find it is necessary to use paid ads to drive traffic to their website if they want to scale sales and substantially grow as a business.
Afterall, nothing is more frustrating than having great products, but your ‘right’ customers don’t even know that you exist.
Regardless of how much demand there is for your products or how much your customers will love your products, without knowing you exists it will not matter.
The scenario of not effectively advertising typically means little to no sales or even worse, sales, but little to no profitability.
Given we know that we need to advertise where should we focus our online marketing efforts?
An undisputed truth when it comes to marketing is that numbers never lie.
Therefore, as marketers it is our job to track the numbers and specifically the right numbers in order to measure and improve the effectiveness of our marketing.
Here are the most common KPI’s (key performance indicators) and the different measurements that I use to guide successful marketing for my private clients. In addition, I’m going to show how I compile this information and use it to make strategic decisions.
I’m using these KPI’s in terms of Google Ads, but you can use these same key performance indicators to evaluate any of your paid marketing channels.
Account Health – KPI’s – Key Performance Indicators
‘Account Health KPI’s’ are used to monitor the health of your advertising channel. They give you a 30,000-foot view to measure your advertising efforts.
These KPI’s should be reviewed on a timeframe that allows enough data to become statistically relevant.
For my private clients, the following Key Performance Indicators are what I use to track on a monthly basis as indicators of the overall health of their accounts.
ROAS – Return on Advertising Spend
An easy formula to calculate, ROAS is calculated simply by dividing dollars generated by dollars spent.
Example, if you spend $1,000 advertising and generate $6,500 in sales, then your ROAS is 6.5. (6,500 / 1,000 = 6.5).
A ROAS below 1 means that you are spending more on ads then generating revenue (of course not good). The higher the ROAS the healthier and typically more profitable is your advertising campaign.
Not only do I track ROAS for the account, but I will use this indicator as a benchmark for individual advertising campaigns.
Note, that ROAS does not account for cost of goods, however, it is a simple calculation that can quickly measure the success of your advertising efforts and that is why I prefer this indicator.
Just like the amateur golfer, you are using this number to compete against yourself striving for better numbers and using ROAS to compare past results.
Rolling CAV – Customer Annual Value
Rolling CAV is calculated by calculating the total sales generated over the last 12 months and dividing by the number of total customers over the last 12 months.
Example, last 12 months your generated $150,000 online and had a total of 1,200 customers, then your CAV is 125. (150,000 / 1,200 = $125)
Note, it is important to use the number of customers and not the number of orders. Using the number of orders will give you the average order value, but not the customer annual value.
This KPI is important because it measures the importance of gaining a new customer. Many times, customers where it initially costs to attain them through paid advertising become exceedingly more valuable as return customers. By keeping track of the CAV, advertisers can determine just how valuable on average each customer is to their business.
True ROAS – True Return on Advertising Spend
This is a combination of your ROAS and your Rolling CAV. I calculate True ROAS to show the annual health of paid advertising and the dollars that I expect marketing to generate over a year.
Why is this metric important?
Unless you are selling one-off goods, typically you will have repeat buyers.
Once a customer purchases your product initiated through paid ads, then the customer is yours. You are free to market to them as you see fit whether that be through email, direct mail or any other variety of touch points.
In addition, generating a new sale from a past customer typically is going to be less expensive than generating that initial purchase and that is reason this metric is important.
Example, last month you spent $1,000 and generated $6,500 in sales for a ROAS of 6.5. This $6,500 was generated by orders from a total of 80 customers.
Over the course of the year, we can expect those 80 customers each to generate an average of $125 in sales based on our current rolling CAV.
Therefore, our True ROAS would be calculated by (80 * 125) / 1000 = 10
This calculation does two things.
First, it demonstrates the importance of gaining new customers by calculating their expected value through the next 12 months and not solely based on the initial sale.
Second, and maybe more importantly, it demonstrates the importance of concentrating on repeat business from your current and past customer base. Increase the CAV from $125 to $200 (just a sale more per customer on average per year) and guess what happens to your true ROAS.
(80 * 200) / 1000 = 16
It goes from 10 to 16!
Optimizing Indicators – KPI’s – Key Performance Indicators
Account Health KPIs are terrific for measuring longer term success. However, measuring success on a monthly basis alone is going to have you more reactive in your account changes instead of proactive.
Fortunately, there are five main optimizing indicators that can give us quick insights into the health of the account on a much more granular level.
When I look at a Google Account for a shorter time frame, such as weekly or even daily, these are the Optimizing Indicators that I review for any sudden spikes or declines.
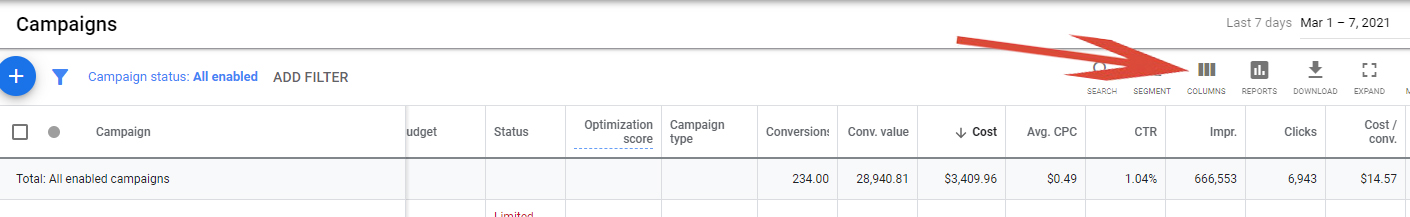
Conversions – Number of total sales.
Conversion Value – Total dollars generated from your sales.
Cost – Dollars spent to generate all sales.
Avg CPC – Total ad spent divided by total clicks.
CTR – Total clicks divided by total impressions.
These Optimizing Indicators are all readily available within the Google Ads Console.
In order to remove or add or even rearrange columns, advertisers can use the column button.
An important realization is that knowing your KPIs are not enough to make successful changes. You must take decisive actions to successfully optimize your paid advertising once KPIs are calculated.
What action?
That is really going to be the million-dollar question or in the case of some eCommerce businesses the multi-million-dollar question.
Throughout my books as well as my podcast I offer different techniques and strategies to optimize on changes both positive and negative to your KPIs and hence to your marketing.
Final Word
What gets measured, get improved. A cliché for certain, but truth none the less.
If you don’t stay on top of your numbers, then your numbers will stay on top of you. I think that I just made that up, but it sounds a bit profound for me so who knows :>
What this article has given you are the key calculations you should be crunching on a monthly basis as well as the KPIs to review on a weekly/daily basis.
Knowing your numbers alone will not help you get better results. Once you have identified a positive or negative trend using Account Health Indicators or you identify a sudden spike or sudden decrease in your Optimizing Indicators it is important to take quick and decisive actions to either halt the negative or capitalize on the momentum.
These actions come in the form of increasing or decreasing bids, adding negative keywords, adjusting bids based on device and a host of other strategies to optimize your paid advertising results.
However, one thing cannot be denied, which is if you don’t keep track of your KPI’s, then you will never know that any action is needed along with the other undeniable fact, which is numbers never lie!
Happy Marketing!
Andy Splichal
ABOUT THE AUTHOR

Andy Splichal is the founder and managing partner of True Online Presence, author of the Make Each Click Count book series, host of the Make Each Click Count podcast, founder of Make Each Click Count University and certified online marketing strategist with twenty plus years of experience helping companies increase their online presence and profitable revenues. In 2020, he was named to Best of Los Angeles Awards’ Most Fascinating 100 List. To find more information on Andy Splichal, visit trueonlinepresence.com or read The Full Story on his website or his blog, blog.trueonlinepresence.com.